Home > IMP3
> Core Transport Simulator (ETS)
> ETS workflows in KEPLER
> ETS_A 4.10a
> Configuring the ETS run
> Visualization during the run
Visualization during the run
There is a number tools visualizing the ETS run.
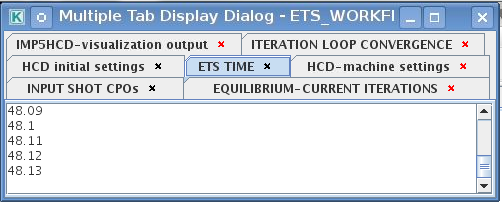
Multiple Tab Display
The display appeares automaticaly when the ETS workflow is launched. It displays diagnostic text messages from the workflow on following topics:
- Input data statement
- Iterations to check the initial convergence between EQUILIBRIUM and CURRENT
- Time evolution
- Convergence of iteratinos within the time step
- IMP5HCD settings
- Power used by IMP5HCD actors durung the run
Also the error messages from execution of the workflow will be displayed here.
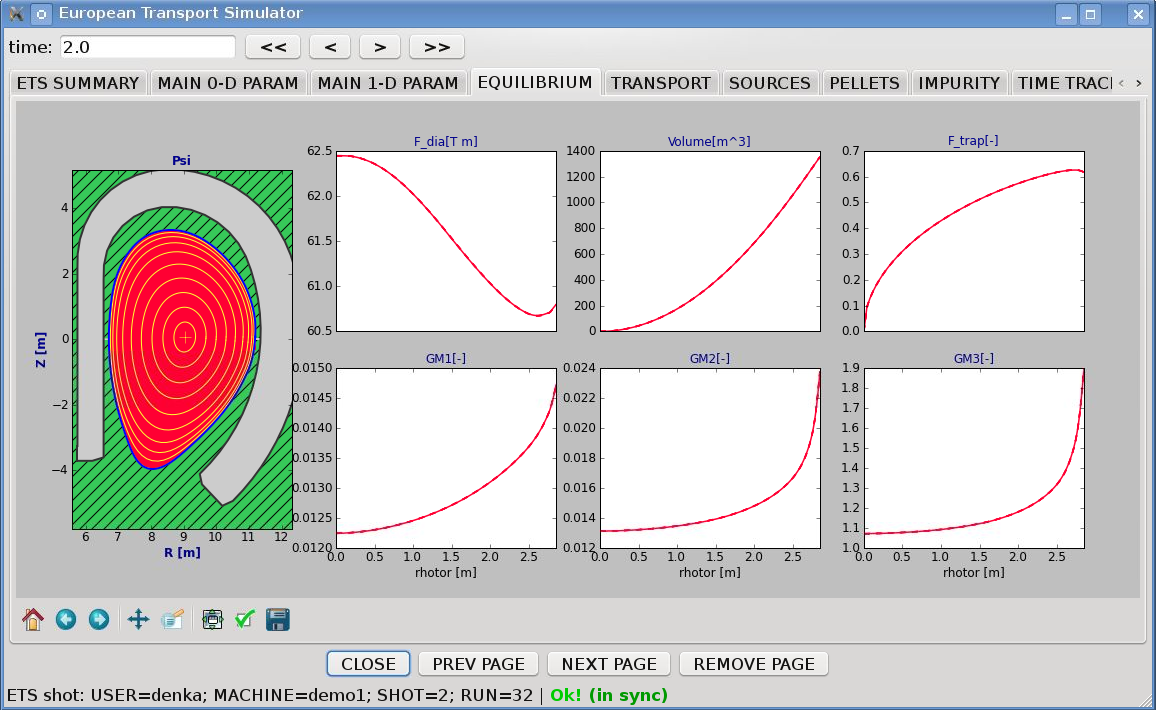
Python Visualization Display
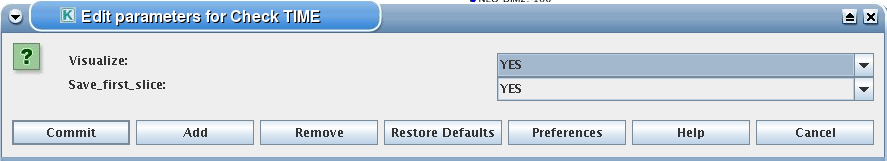
You can activate the graphical visualization of your run evolution:
- right click on the box ‘Check Time & Save Slice’
- select ‘Configure actor’
- select visualisation ‘YES’ or ‘NO’
- Commit
Then evolution of main discharge parameters will be shown in this window: